
Content
Introduction
Global Filters
Plan Usage Overview
Monthly Usage
Application Data Users
Remaining Credit Balance
Total Database Storage
File Server Storage
Introduction
The System Consumption in the Dashboard helps to gain clarity about your system usage, including all credit-based actions and consumptions. Ideally, leverage this insight to optimise your system usage and identify any excessively high consumption rates.
The System Consumption data is displayed according to the client's EOH application package, such as Bronze, Silver, Gold, or Platinum, and provides comprehensive insights for:
- Plan Usage Overview
- Monthly Usage
- Application Total Users
- Remaining Credit Balance
- Total Database Storage
- File Server Storage
Global Filters
The Global Filters in the System Consumption filter the data based on the selected Organisation(s) name, Dashboard name, and Choose Month. Once the filters are configured, click the Get Data button, and the data is displayed based on the selected filter.
Note that the data within System Consumption is updated once a day.
- Organisation – All the available Organisation names will be displayed. When multiple organisations exist, you can select several to fetch data from the selected organisations
- Dashboard – The dashboard(s) are available for selection based on the Configuration Settings
Note that the administrator has access to view all dashboards across all users, while other users can only view the dashboards based on the access permission provided- Set to Default – The 'Set as Default' checkbox allows you to designate a default dashboard that will automatically load each time you access the dashboard. In case a single dashboard exists, it will automatically be set as the default dashboard
- Choose Month – shows the data for the selected month, and by default current month is selected
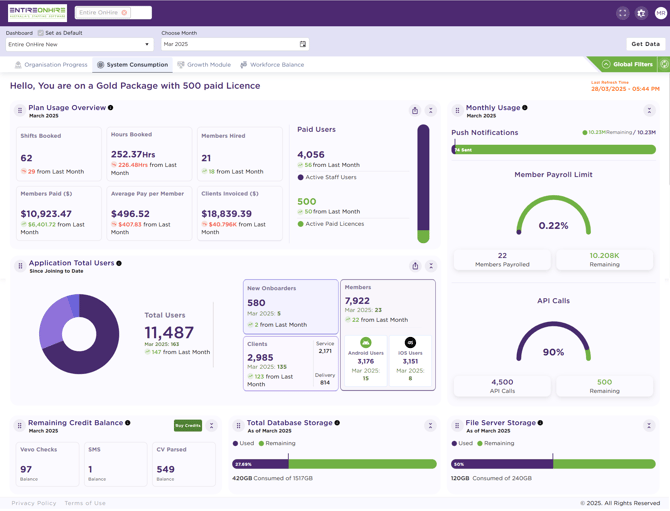
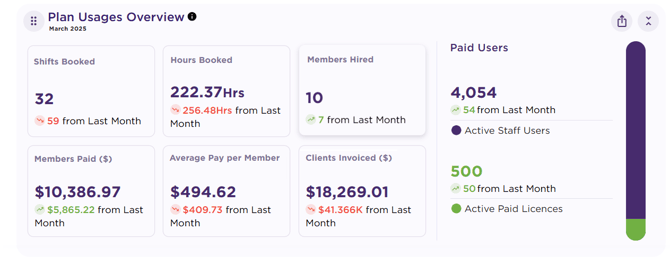
1. Plan Usage Overview
The Plan Usage Overview section shows the following components for the selected month:
- Shifts Booked – shows the number of shifts booked with the Status as Shift Booked and Timesheet Submitted
- Hours Booked – shows the total shift hours with Status as Shift Booked and Timesheet Submitted
- Members Hired – shows the count of members with an Active employment status
- Members Paid ($) – shows the total payroll amount paid to members
- Average Pay Per Member – shows the average amount paid to a member. The Average Pay Per Member is calculated by dividing the total amount paid to members by the total number of members paid
For instance, in February 2025, if 50 members were paid $45,000, the Average Pay Per Member will be calculated as $45000/ 50 = $900 - Clients Invoiced ($) – shows the total invoiced amount generated for all the clients
- Paid Users:
- Active Staff Users – number of staff authorised to access the EOH application
- Active Paid Licences – number of paid licences permitted to login to the EOH application simultaneously
For instance, if the EOH system has 100 active users and 10 paid licences, only 10 users can access the EOH system simultaneously
Here, an upward green ![]() arrow indicates an increase in figures compared to the last month, while a downward red
arrow indicates an increase in figures compared to the last month, while a downward red ![]() arrow indicates a decrease relative to the last month.
arrow indicates a decrease relative to the last month.
- View Data – You can view and search the required Plan Usage Overview metrics. To search and download the data:
- Click the View Data icon, and the Plan Usage Overview pop-up opens as shown in the figure below

- In the Plan Usage Overview pop-up, you can view and search the required metric(s) and download the data in Excel and PDF format

- Click the Excel or PDF option to download the data in Excel and PDF formats respectively

- On selecting the Excel or PDF option, the Plan Usage Overview will be downloaded and available for printing


- Click the View Data icon, and the Plan Usage Overview pop-up opens as shown in the figure below
2. Monthly Usage
The Monthly Usage section displays data based on the client's EOH application package, such as Bronze, Silver, Gold, or Platinum. It displays the data based on total availability, monthly usage, and the remaining limit for the selected month.

- Push Notifications – shows the number of push notifications:
- Sent to members (as indicated within the progress bar)
- Remaining notifications available to send
- Total notifications allowed to send

- Member Payroll Limit: shows the number of members:
- Processed for payroll
- Remaining payroll allowance available to send
- Total percentage of member payroll allowance consumed (as indicated within the progress bar)

- API Calls: shows the total number of:
- API calls consumed
- Remaining number of API calls available for user execution
- Total percentage of API Calls consumed (as indicated within the progress bar)

3. Application Data Users
The Application Data Users section provides an overview of the Total Users, including New Onboarders, Clients, and Members of the application since its inception as well as for the selected month.
- Total Users – shows the total number of application users, including New Onboarders, Clients, and Members since inception along with the total user count for the selected month

The pie chart illustrates the number of New Onboarders, Clients, and Members. When hovering over the chart, the precise numbers are displayed as shown in the figure - New Onboarders – shows the total count of new onboarders (applicants with the application status as 'New' and 'Interview') along with the total new onboarders for the selected month
- Clients – shows the total count of clients (clients with location type as ADMIN AND SERVICE, SERVICE, and DELIVERY) along with the total new clients for the selected month
- Service – shows the total count of clients with location type as ADMIN AND SERVICE, and SERVICE
-
- Delivery – shows the total count of clients with location type as DELIVERY
- Members – shows the total count of members with the status as active, inactive, or suspended (except terminated members), along with the total new members for the selected month
-
- Android Users – shows the total count of Android Users who have downloaded the app, along with the total new Andriod users for the selected month
- iOS Users – shows the total count of iOS users who have downloaded the app, along with the total new iOS users for the selected month
- View Data - To view and search the required Application Total Users metrics. You can download the data in Excel and PDF formats as explained in the Plan Usage Overview section above
Here, an upward green ![]() arrow indicates an increase in figures compared to the last month, while a downward red
arrow indicates an increase in figures compared to the last month, while a downward red ![]() arrow indicates a decrease relative to the last month.
arrow indicates a decrease relative to the last month.

4. Remaining Credit Balance
The Remaining Credit Balance shows the available balance for the Vevo Checks, SMS, and CV Parsed for the selected month. Once credits for Vevo Checks, SMS, and CV Parsed are used, you can purchase more credits using the Buy Credits links.
Note that the Vevo Checks, SMS, and CV Parsed credits are added on the 1st of every month.
- Vevo Checks – shows the current available credit balance for Vevo Checks
- SMS – shows the current available credit balance for SMS
- CV Parsed – shows the current available credit balance for CV Parsed
- Buy Credits – link to buy credits for Vevo Checks, SMS, and CV Parsed from the EOH Online Store

5. Total Database Storage
The Total Database Storage displays data based on the client's EOH application package (e.g., Bronze, Silver, Gold, or Platinum). The database stores the transactional data, including details of members, clients, shifts, rates, and invoices/payslips, and shows:
- Current data volume stored within the system
- Remaining storage capacity available for future

6. File Server Storage
The File Server Storage displays storage limit based on the client's EOH application package (e.g., Bronze, Silver, Gold, or Platinum). The file server storage retains physical files, such as documents, payslips, invoices, timesheets, resumes, and shows:
-
- Current volume of files stored within the system
- Remaining files storage capacity available for future

Related Articles:
Dashboard
Configure Dashboard
Organisation Progress
Features
Workforce Balance