Purpose
The Gross Margin By Client report provides a financial summary of revenue, costs, and profit margins across clients or members for a selected time period.
It helps businesses assess profitability per client, evaluate commission impacts, and identify areas of revenue leakage or high labour cost ratios.
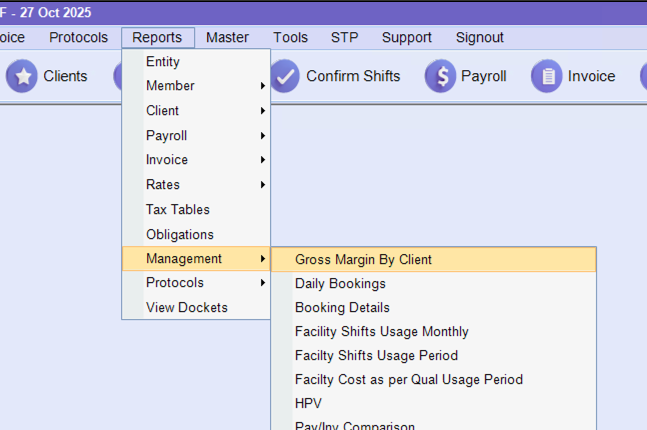
Authorised Users can access the report by selecting:
Reports > Management > Gross Margin by Client
The above options are broken down below
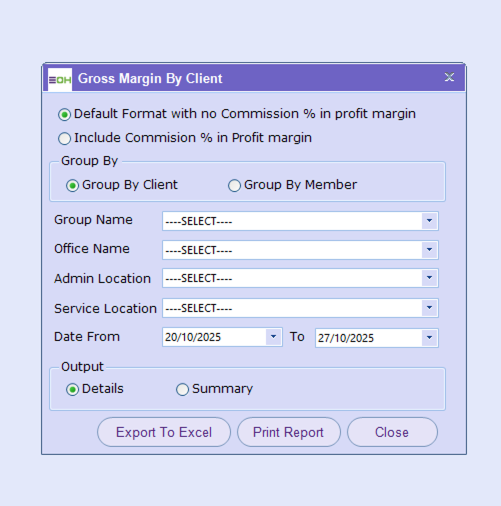
Filter Options
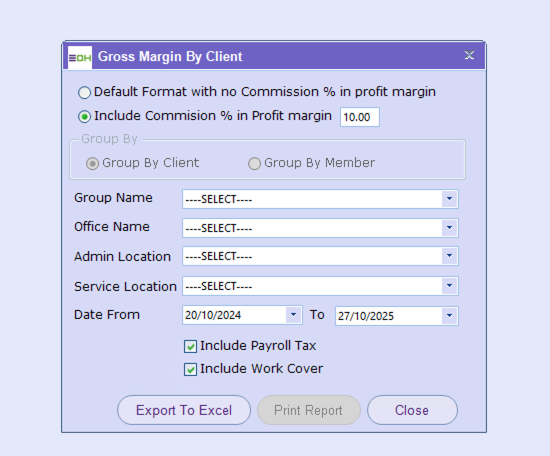
Profit Margin Settings
| Option | Description |
|---|---|
| Default Format with no Commission % in profit margin | Generates the gross margin report excluding commission calculations. This provides a pure revenue-versus-cost profit percentage. |
| Include Commission % in Profit Margin | Includes commission amounts in the margin calculation, giving a more comprehensive view of total profitability (including staff or agent commissions). |
Group By
Determines how results are categorised in the report.
| Option | Description |
|---|---|
| Group By Client | Aggregates results per client, showing gross margin by customer or business account. This is the most common view for profitability tracking. |
| Group By Member | Breaks down results per individual staff member or contractor, allowing analysis of profit contribution per worker. |
Filter Fields
| Field | Description |
|---|---|
| Group Name | Filters the report by a specific business or organisational group. Useful when multiple business units or divisions exist. |
| Office Name | Narrows down results to a specific office location, ideal for companies operating across multiple branches. |
| Admin Location | Filters by the administrative region or department responsible for managing the client or member data. |
| Service Location | Allows selection of a specific client site, facility, or work location for focused financial analysis. |
| Date From / To | Defines the reporting date range. The report will calculate revenue, costs, and gross margin within these start and end dates (e.g. 20/10/2025 – 27/10/2025). |
Output Format
| Option | Description |
|---|---|
| Details | Provides a line-by-line breakdown of each transaction, client, or member, showing granular financial data such as revenue, cost, and profit per record. |
| Summary | Generates a condensed view, summarising total revenue, total cost, and average gross margin percentage for each selected grouping. |
Buttons
| Button | Description |
|---|---|
| Export To Excel | Exports the report results into an Excel file for further financial analysis or record-keeping. |
| Print Report | Generates a printable version of the report in the selected output format (Details or Summary). |
| Close | Exits the Gross Margin By Client window without generating or exporting the report. |
Use Cases
-
Finance / Accounts Teams: To analyse profitability trends and ensure contracts remain financially viable.
-
Operations Managers: To review cost efficiency and performance per client or team.
-
Executives / Leadership: To identify high- or low-margin clients and make strategic pricing or staffing decisions.
-
Account Managers: To support client discussions with profitability insights.
Example of Reports
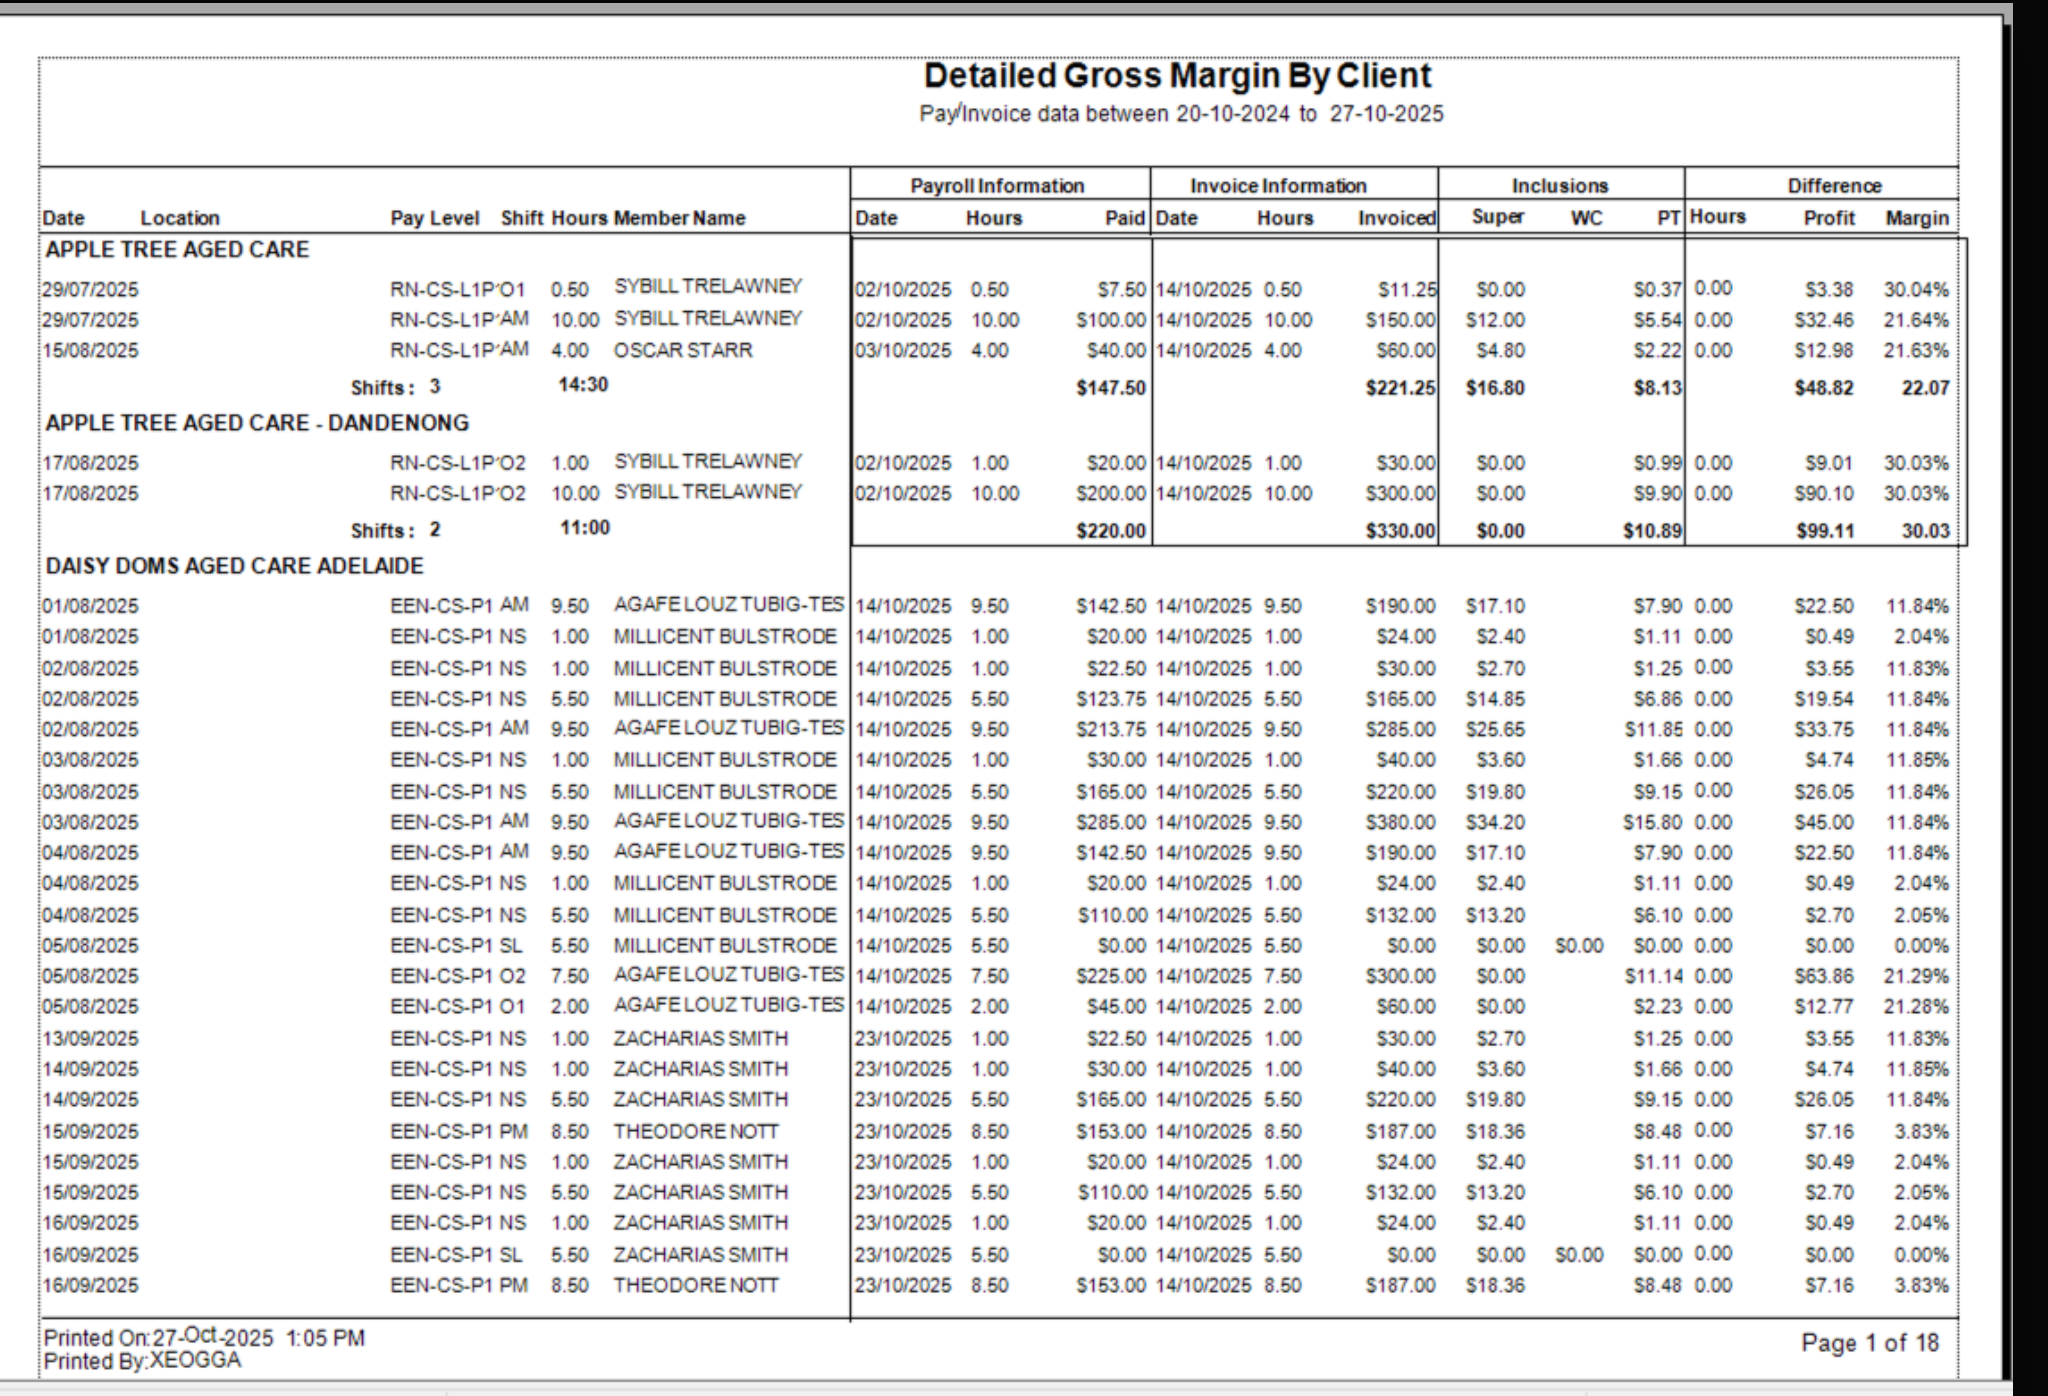
Detail Per Client
Report Header
| Field | Description |
|---|---|
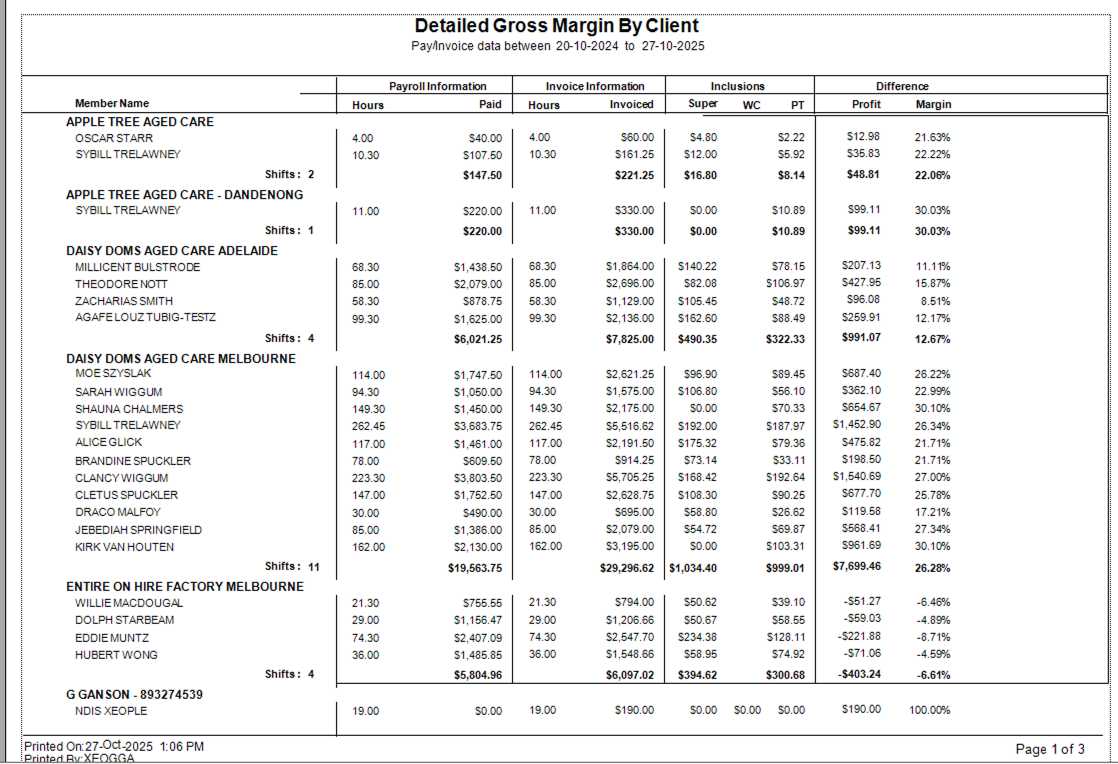
| Title | Displays the report name: Detailed Gross Margin By Client. |
| Date Range | Shows the payroll and invoice data period used in the report (e.g. Pay/Invoice data between 20-10-2024 to 27-10-2025). |
| Grouping | Data is grouped by client (e.g. Apple Tree Aged Care, Daisy Doms Aged Care Adelaide), and within each client, by location or site. |
Column Breakdown
Left Section – Shift & Member Details
| Column | Description |
|---|---|
| Date | The date on which the shift occurred or was paid. |
| Location | The client or facility where the shift was worked. |
| Pay Level | The employee’s pay classification (e.g. RN-CS-L1P¹, EEN-CS-P1). This corresponds to the award or enterprise agreement pay scale. |
| Shift Hours | The number of hours worked during that shift. |
| Member Name | The name of the staff member who performed the shift. |
Centre Section – Payroll Information
| Column | Description |
|---|---|
| Date (Payroll) | The date the shift was processed for payroll. |
| Hours (Payroll) | The total hours paid for that shift in payroll records. |
| Paid | The total amount paid to the member for that shift. This represents the labour cost incurred by the company. |
Right Section – Invoice Information
| Column | Description |
|---|---|
| Date (Invoice) | The date the shift was invoiced to the client. |
| Hours (Invoice) | The number of hours billed to the client. |
| Invoiced | The total amount charged to the client for the shift. |
| Inclusions (Super / WC / PT) | Breaks down additional on-costs applied in gross margin calculations: - Super: Superannuation contribution - WC: Workers’ Compensation - PT: Payroll Tax |
Final Section – Calculated Profitability
| Column | Description |
|---|---|
| Hours (Difference) | Any difference between payroll and invoiced hours (e.g. rounding or adjustments). |
| Profit | The dollar value of gross profit (Invoiced amount – Paid amount – On-costs). |
| Margin (%) | The profit margin percentage, calculated as (Profit ÷ Invoiced Amount) × 100. Indicates how much profit was made per shift. |
Grouped Totals
At the end of each client or location section:
-
Shifts: Displays total shift count and total hours worked.
-
Payroll & Invoice Totals: Summarises all hours, pay amounts, and invoice values.
-
Profit & Margin Totals: Shows cumulative profit and overall margin percentage for that client.
Footer Information
| Field | Description |
|---|---|
| Printed On / By | Shows the timestamp and user who generated the report (e.g. Printed On: 27-Oct-2025 1:05 PM by XEOGGA). |
| Page Number | Indicates report pagination (e.g. Page 1 of 18). |
Key Insights
-
Profit Tracking: Quickly identifies which clients, sites, or members yield higher or lower margins.
-
Variance Detection: Highlights discrepancies between paid hours and invoiced hours.
-
Cost Transparency: Provides a full view of payroll versus billable income, including on-costs like super, workers’ compensation, and payroll tax.
-
Performance Benchmarking: Enables financial teams to monitor gross margin trends by client or region over time.
Use Cases
-
Finance & Accounting: Reconcile revenue and labour cost per client to verify profitability.
-
Operations Management: Identify underperforming sites or contracts where margins are shrinking.
-
Client Reviews: Present profitability summaries during account performance discussions.
-
Executive Reporting: Use the summary output for quarterly gross margin analysis and pricing strategy.
Summary per Client
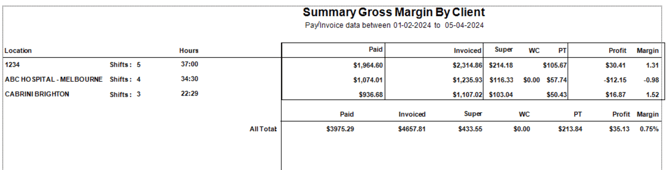
The Detailed Gross Margin By Client report provides a complete breakdown of labour costs, invoice amounts, and profit margins per client, member, and location.
It combines payroll and invoice data within a specified date range to calculate profitability per shift, showing exactly how much revenue was invoiced, how much was paid to staff, and the resulting gross profit and margin percentage.
Report Header
| Field | Description |
|---|---|
| Title | Displays the report name: Detailed Gross Margin By Client. |
| Date Range | Shows the payroll and invoice data period used in the report (e.g. Pay/Invoice data between 20-10-2024 to 27-10-2025). |
| Grouping | Data is grouped by client (e.g. Apple Tree Aged Care, Daisy Doms Aged Care Adelaide), and within each client, by location or site. |
Column Breakdown
Left Section – Shift & Member Details
| Column | Description |
|---|---|
| Date | The date on which the shift occurred or was paid. |
| Location | The client or facility where the shift was worked. |
| Pay Level | The employee’s pay classification (e.g. RN-CS-L1P¹, EEN-CS-P1). This corresponds to the award or enterprise agreement pay scale. |
| Shift Hours | The number of hours worked during that shift. |
| Member Name | The name of the staff member who performed the shift. |
Centre Section – Payroll Information
| Column | Description |
|---|---|
| Date (Payroll) | The date the shift was processed for payroll. |
| Hours (Payroll) | The total hours paid for that shift in payroll records. |
| Paid | The total amount paid to the member for that shift. This represents the labour cost incurred by the company. |
Right Section – Invoice Information
| Column | Description |
|---|---|
| Date (Invoice) | The date the shift was invoiced to the client. |
| Hours (Invoice) | The number of hours billed to the client. |
| Invoiced | The total amount charged to the client for the shift. |
| Inclusions (Super / WC / PT) | Breaks down additional on-costs applied in gross margin calculations: - Super: Superannuation contribution - WC: Workers’ Compensation - PT: Payroll Tax |
Final Section – Calculated Profitability
| Column | Description |
|---|---|
| Hours (Difference) | Any difference between payroll and invoiced hours (e.g. rounding or adjustments). |
| Profit | The dollar value of gross profit (Invoiced amount – Paid amount – On-costs). |
| Margin (%) | The profit margin percentage, calculated as (Profit ÷ Invoiced Amount) × 100. Indicates how much profit was made per shift. |
Grouped Totals
At the end of each client or location section:
-
Shifts: Displays total shift count and total hours worked.
-
Payroll & Invoice Totals: Summarises all hours, pay amounts, and invoice values.
-
Profit & Margin Totals: Shows cumulative profit and overall margin percentage for that client.
Footer Information
| Field | Description |
|---|---|
| Printed On / By | Shows the timestamp and user who generated the report (e.g. Printed On: 27-Oct-2025 1:05 PM by XEOGGA). |
| Page Number | Indicates report pagination (e.g. Page 1 of 18). |
Key Insights
-
Profit Tracking: Quickly identifies which clients, sites, or members yield higher or lower margins.
-
Variance Detection: Highlights discrepancies between paid hours and invoiced hours.
-
Cost Transparency: Provides a full view of payroll versus billable income, including on-costs like super, workers’ compensation, and payroll tax.
-
Performance Benchmarking: Enables financial teams to monitor gross margin trends by client or region over time.
Use Cases
-
Finance & Accounting: Reconcile revenue and labour cost per client to verify profitability.
-
Operations Management: Identify underperforming sites or contracts where margins are shrinking.
-
Client Reviews: Present profitability summaries during account performance discussions.
-
Executive Reporting: Use the summary output for quarterly gross margin analysis and pricing strategy.
Details Per Member
Details
Purpose
The Details Per Member report provides a breakdown of payroll, invoice, and profitability data by individual member (employee or contractor) under each client.
It is used to assess the profit margin generated by each worker, showing how labour costs, hours worked, and invoiced amounts contribute to client-level profitability.
This view supports operational and financial performance monitoring across teams, qualifications, and work sites.
Report Header
| Field | Description |
|---|---|
| Title | Detailed Gross Margin By Client |
| Date Range | Displays the payroll and invoice data range included in the report (e.g. 20-10-2024 to 27-10-2025). |
| Grouping | Data is grouped by Client / Location, and within each client, by Member Name. |
Column Breakdown
Member Details
| Column | Description |
|---|---|
| Member Name | The staff member who worked the shifts. Each member’s total is grouped under their client. |
| Shifts | The number of completed shifts for that member under the listed client. |
| Hours (Payroll) | Total worked hours recorded in payroll data for that member. |
| Paid | The total amount paid to the member for their hours worked. This reflects the organisation’s labour cost. |
Invoice Information
| Column | Description |
|---|---|
| Hours (Invoice) | Total hours billed to the client for that member’s work. Usually aligns with paid hours unless adjustments occur. |
| Invoiced | The total amount invoiced to the client for the member’s work. This represents revenue generated. |
Inclusions (On-Costs)
| Column | Description |
|---|---|
| Super | Superannuation contributions associated with the member’s payroll. |
| WC (Workers Compensation) | Workers’ compensation contributions applied for that member. |
| PT (Payroll Tax) | Payroll tax portion allocated to that member’s earnings. |
Difference (Profit & Margin)
| Column | Description |
|---|---|
| Profit | The total profit earned from the member’s shifts. Calculated as: |
| Profit = Invoiced – (Paid + Super + WC + PT) | |
| Margin (%) | The percentage of profit relative to invoiced revenue: |
| Margin = (Profit ÷ Invoiced) × 100 |
Grouped Totals
At the end of each client group:
-
Shifts and Hours: Displays total shifts and hours worked across all members.
-
Payroll & Invoice Totals: Summarises all pay, invoice, and cost data.
-
Profit & Margin: Shows combined profit dollars and the overall gross margin percentage for the client.
Footer Information
| Field | Description |
|---|---|
| Printed On / Printed By | Displays report generation details for audit purposes (e.g. Printed On 27-Oct-2025 by XEOGGA). |
| Page Number | Indicates total pages in the report (e.g. Page 1 of 3). |
Key Insights
-
Member-Level Profitability: Identifies which employees or contractors contribute most to client profitability.
-
Variance Tracking: Highlights inconsistencies between hours worked and hours invoiced.
-
Cost Transparency: Includes all on-costs (Super, WC, PT) to show true profitability.
-
Client Comparison: Allows managers to compare performance across multiple client sites and teams.
Use Cases
-
Finance Teams: Analyse margins by staff to ensure labour costs align with pricing.
-
Operations Managers: Identify underperforming members or teams affecting profitability.
-
Account Managers: Provide evidence of service cost breakdowns during client reviews.
-
Executive Leadership: Review performance by client, member, and cost allocation for strategic decision-making.
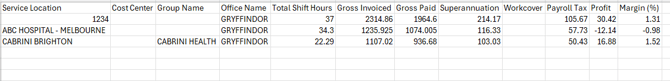
Using - Include Commision % in Profit Margin
If you select Include Comision % in Profit Margin
Purpose
This Excel export provides a detailed, line-by-line financial view of every shift transaction within the selected period.
It calculates true profit and margin by incorporating:
-
Commission percentage (e.g. 10 %)
-
Superannuation
-
Payroll Tax (PT)
-
Work Cover (WC)
-
All invoicing and payment information
The report enables analysis of cost-to-revenue ratios for each member, pay level, and service location.
Column Breakdown
| Column Name | Description |
|---|---|
| Period Ending Date | The pay period or week-ending date that the shift falls under. |
| Shift Date | The actual date the shift was worked. |
| Consultant Name | The consultant or internal recruiter linked to the shift (if applicable). |
| Service Location | The client or site where the shift occurred. |
| Delivery Location | The physical or operational sub-site where work was performed (e.g. Ward 1, Factory Floor). |
| Group Name | The organisational or reporting group associated with the shift (e.g. NDIS, Aged Care, Industrial). |
| Office Name | The internal office or branch managing that client (e.g. Melbourne, Brisbane). |
| Pay Level | The pay level or award classification for the member’s role (e.g. Labourer CWL1, RN Level 1). |
| Member Name | The employee or contractor who performed the shift. |
| Invoice No. | The invoice number generated for that client and shift. |
| Invoice Date | The date the client invoice was issued. |
| Shift | The specific shift identifier (e.g. MON – O1 or PM Shift). |
| Inv Hour | The total billable hours invoiced to the client for this shift. |
| Inv Rate | The hourly billing rate charged to the client (excluding GST). |
| Invoice Ex GST | The invoice amount excluding GST (Inv Hour × Inv Rate). |
| GST | The 10 % GST charged to the client. |
| Invoice Inc. GST | Total invoiced amount including GST (Invoice Ex GST + GST). |
| Pay Date | The payroll date on which the member was paid. |
| Pay Hour | The total payable hours recorded for the member. |
| Pay Rate | The hourly rate paid to the member. |
| Gross Pay Amount | Pay Hour × Pay Rate — the member’s gross wage for that shift. |
| Superannuation | Employer super contribution for that shift. |
| Total Pay | Gross Pay Amount + Superannuation — total direct payroll cost before commissions or taxes. |
| Commission Ex GST | The commission expense (excluding GST) applied to this shift, based on the set commission % (e.g. 10 %). |
| GST on Commission | The 10 % GST calculated on the commission amount. |
| Commission Inc. GST | Total commission including GST (Commission Ex GST + GST on Commission). |
| Total Gross Pay Inc. Commission | The total cost including wages, super, and commission. |
| WC (Work Cover) | The calculated Work Cover insurance cost for this shift. |
| PT (Payroll Tax) | The calculated Payroll Tax for the shift. |
| Margin ($) | The total profit or loss for the shift after all costs. |
| Formula: | |
Margin = (Invoice Ex GST) – (Total Gross Pay Inc. Commission + WC + PT) |
|
| Margin (%) | The profit margin percentage relative to revenue. |
| Formula: | |
Margin (%) = (Margin ÷ Invoice Ex GST) × 100 |
Key Calculations
-
Invoice Revenue:
Inv Hour × Inv Rate -
Total Cost:
Gross Pay Amount + Super + Commission + WC + PT -
Profit (Margin $):
Invoice Ex GST – Total Cost -
Margin %:
(Profit ÷ Invoice Ex GST) × 100
Key Insights
-
This export reflects real profitability at the shift level, showing when costs (commission, taxes, or on-costs) exceed invoice value.
-
Negative margins (displayed as “- %”) highlight shifts where labour costs outweighed invoiced revenue.
-
Commission inclusion ensures that internal sales or recruiter commissions are visible in the cost of delivery.
-
Payroll Tax and Work Cover provide accurate employer on-cost visibility for compliance and financial forecasting.
Use Cases
-
Finance: Validate true profit per shift and reconcile against invoicing.
-
Operations: Identify low-margin clients or shifts for pricing review.
-
Account Management: Support contract renegotiations by demonstrating actual cost structures.
-
Leadership & Reporting: Integrate with Excel dashboards for full gross-margin tracking across offices or divisions.
These report can be exported directly as an Excel Document, using the Export to Excel option.